DETERMINATION OF IRON AND COPPER IN 18th AND 19th CENTURY BOOKS BY FLAMELESS ATOMIC ABSORPTION SPECTROSCOPYLucia C. Tang
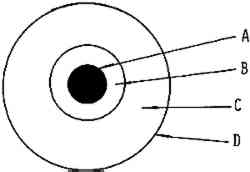
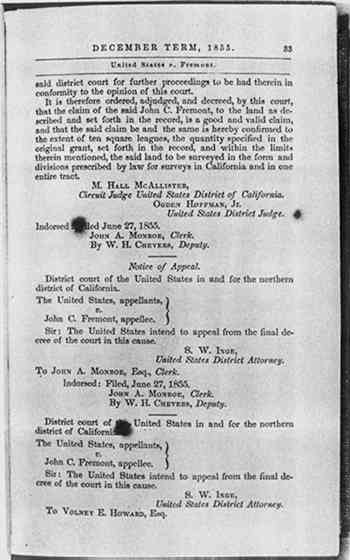
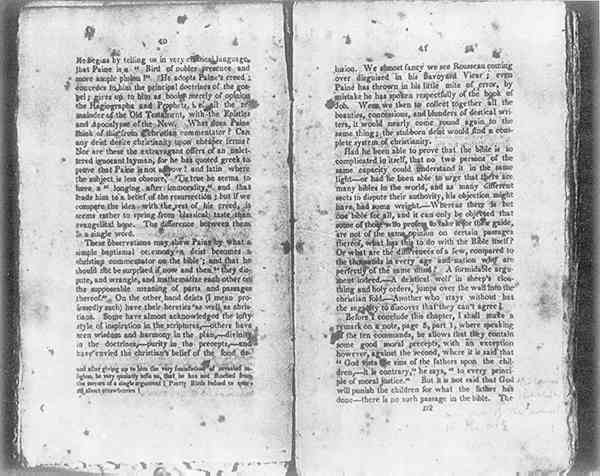
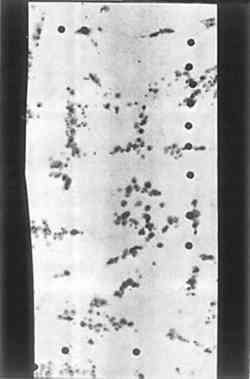
ABSTRACT—Several badly foxed books and a paper handmade in our laboratory were studied for the presence and location of iron and copper compounds. The iron content of foxing spots and clear paper areas in the books showed a significant difference. However, the copper content of these areas was not significantly different. On the other hand, in our handmade paper it was the copper content that varied significantly in these areas. Traditionally, these elements in paper have been analyzed by gravimetric and titrimetric analytical techniques, colorimetry, or flame atomic absorption. CRA (Carbon Rod Atomizer), used with atomic absorption equipment, offers a simple, rapid and extremely sensitive method of determining metals in cellulosic materials directly on the solid sample. 1 INTRODUCTIONPreviously, foxing of old papers has been associated with action of biological organisms such as molds, and with the presence of iron in the paper. Storage in a damp environment is also believed to contribute to foxing. Certainly, iron is suspect. Almost all papers contain small amounts of iron, and some have an appreciable content. The color of foxing (yellow, brown, or red-brown) suggests iron. Read, Eade and Slingsby2 mention that ferric ions cause an immediate darkening of pulp and also accelerate brightness reversion. Iron in paper is not uniformly distributed. Since the invention of the papermaker's beater in Holland, particles of iron have been regularly struck off the bedplate and carried along with the fiber to lodge in the sheet. The center of a foxed spot sometimes shows a tiny particle of iron oxide. Not all investigators agree that iron is the cause of foxing. Press3 examined 91 samples of paper using X-ray fluorescence spectroscopic methods and a spectrophotofluorometer and concluded: “Although the amount of foxing was not independent of iron concentration, the relationship was inverse rather than positive.” Press, Iiams,4 Iiams and Beckwith,5 Beckwith, Swanson and Iiams,6 and Baynes-Cope,7 agree that mold plays a major role in the production of the spots. Mold can often be cultured from foxed spots, and fluorescence, usually indicating the presence of a mold-produced color, can be seen when the spots are illuminated with ultraviolet light. The effect of high humidity in producing foxing has been taken to indicate that it is produced by molds, since molds grow and proliferate at humidities above 70%. On the other hand, cellulose is directly oxidized catalytically in the presence of iron, copper and cobalt compounds, and the reaction is most rapid at high humidities.8 Koenigs9 gave evidence that some fungi employ an H2O2 and Fe++ system to attack cellulose. He also stated, “Peroxide and Fe++ caused large losses in strength and rapidly depolymerized cotton threads at low weight losses; they also increased the swelling and alkali solubility of residual cellulose … the same treatment increased the susceptibility of residual cellulose to the active enzyme preparation.” Beckwith, Swanson and Iiams6 state that the color change caused by foxing almost invariably means degradation of the paper at the spot. They wrote, “We noted that the foxed paper disintegrated in the acid solution much more rapidly than did the unaffected paper.” Iiams and Beckwith5 reported lower tensile strength in foxed areas, on p. 418. Previously, the iron and copper content in paper has been determined by colorimetric methods,10,11,12 X-ray fluorescence,13,14,15,16 neutron activation analysis,17,18,19,20 and flame atomic absorption spectrophotometry.2,21,22,23,24 These methods for determining the trace metal content of paper are limited since large amounts of samples are required. With the advent of flameless atomic absorption spectrophotometric techniques, quite small samples of paper can be analyzed. Using this equipment, it proved possible in the present investigation to analyze the individual foxed spots and determine the metal content as compared to the unspotted areas of the paper. One limitation of the investigation should be pointed out. While the presence of iron and copper can be established by the methods used, these methods do not give information as to whether the metal is in a catalytic form. 2 EXPERIMENTAL2.1 ApparatusA Perkin-Elmer model AD-2 electronic ultramicrobalance was used for the accurate weighing of the paper samples. A Varian Techtron AA-6 spectrophotometer was used with a model 90 carbon rod atomizer and a potentiometric A-25 recorder. The standard graphite cup was supported by two side electrodes. Instrumental operating parameters25 are shown in Table I. The solid samples were introduced into the cup atomizer with tweezers. Standard solutions were inserted into the cup atomizer by means of a 5 μl Oxford pipet. TABLE I INSTRUMENT PARAMETERS AND ALTERNATIVE ABSORPTION LINES 2.2 Preparation of SamplesThe paper samples were obtained from 8 books of 18th and 19th century origin and various papers. 2.2.1 Book Paper FoxingThis was of three basic varieties: a) light brown spots, b) dark brown spots, as shown in Figure 5, and 3) dark-centered spots, fading toward the periphery, as shown in Figures 1 and 3. Samples were taken of all three for analysis, limited to the unprinted book spaces. Control samples were taken from the same pages as the foxing samples, also limited to unprinted book spaces.
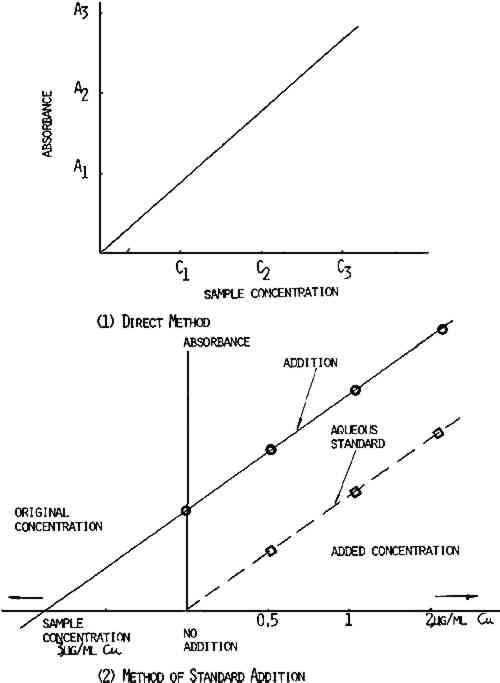
2.2.2 Handmade Paper FoxingThis appeared as light or dark brown spots and was found on laboratory handmade paper. Samples of the foxed spots were analyzed for iron and copper content. When possible, a titanium punch was used to cut 2.8mm diameter samples from the books and papers. However, foxed spots showed increased brittleness as compared to the nonfoxed areas—often disintegrating on sampling. To eliminate this problem, foxed spots were cut out using a small scalpel blade and tweezers. The weight of samples taken varied from 0.05 to 0.8mg. Where the spots were very dark, a smaller sample was adequate. 2.3 Standards and Calibration ProceduresThe distilled water or tap water was purified by passing it through a cation exchange cartridge (Universal cartridges, No. 1506–20, Cole Parmer Instrument Co.) and a second cation exchange cartridge (Research cartridges, No. 1506–30, Cole Parmer Instrument Co.) to remove all metal ions. Throughout this study, 1000 ppm atomic absorption standards (Fisher Chemical Co.) were used. Calibration standards of 0.5, 1, and 2.0 μg/ml Cu and 20, 50, and 100 μg/ml Fe were prepared by diluting the standard with deionized water. In the calibration of the atomic absorption instrument, there are two accepted methods—the direct method and the addition method. The method of choice depends on the chemical composition, the sample, and also the method of sample preparation. The When the direct method is used, the carbon rod atomizer is calibrated using known concentration of metals in aqueous solution. The peak height or the absorbence signal value is plotted versus the concentration of the element being analyzed. The sample absorbence signal is compared to the absorbence signal of the calibration standard, as shown in Figure 2. However, when a direct comparison is made between dilute aqueous standards and a sample prepared by wet procedure using acid, a complex matrix may be formed such that viscosity, dissolved salt content, and surface tension will cause chemical interferences in this situation. The addition method is used and a calibration curve is run by adding known amounts of each element to the sample, as shown in Figure 2. Since the slope for the addition method curve is the same as the slope for the direct method curve, as shown in Figure 2, the direct method was employed in this study. In addition, all values reported are based on the factor from aqueous standards, since the addition method gave essentially the same results.
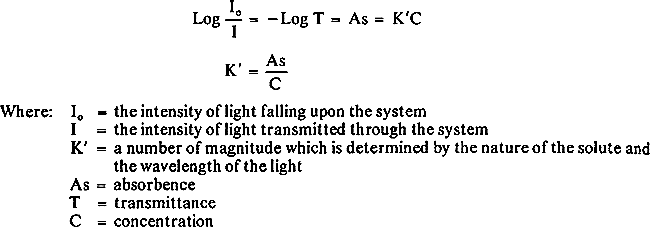
2.4 ProcedurePaper samples were weighed on the Perkin-Elmer AD-2 electronic ultramicrobalance. The solid paper samples were introduced directly into the carbon cup atomizer with tweezers where they were dried, ashed, and atomized for analysis of copper and iron. Since the two methods gave essentially the same results, the direct method was used in modified form. After calculating the slope of the calibration curve, the concentration of each sample could be determined by dividing absorbence of the unknown sample by the calibrated slope. This procedure was used since it was established that the slopes for each element in every sample were identical. This method afforded a quick and exact determination of metal content in paper and eliminated much of sample preparation. 2.5 CalculationThe unknown sample was analyzed from the standard curve, as shown in Figure 2. The metal content was calculated by using Beer's Law. According to Beer's Law,
Calculations of factors from various aqueous standard solutions are shown in Tables II and III. Table IV shows how to use the factors from Tables II and III to determine the iron and copper content in books and library materials. TABLE II CALCULATION OF FACTOR FROM VARIOUS AQUEOUS COPPER STANDARD SOLUTIONS TABLE III CALCULATION OF FACTOR FROM VARIOUS AQUEOUS IRON STANDARD SOLUTIONS TABLE IV THE IRON AND COPPER CONTENT FROM BOOKS AND VARIOUS PAPERS 3 RESULTS AND DISCUSSIONIn order to examine the distribution and variability of trace elements in foxing spots and clear areas of the book papers, samples were taken from various pages of five books. The copper and iron contents in 18th and 19th century books are shown in Table V. The table also shows the location of the samples taken. There is a trend for darkness of the foxing spot to increase with increasing iron content, apparent in the data. The highest concentration of iron was noted in the center of the spots, with the metal concentration decreasing in TABLE V THE IRON AND COPPER CONTENT IN 18TH AND 19TH CENTURY BOOKS The concentration of the trace elements differs remarkably between the foxing spots and clear areas of the book page. It seems that the critical element in foxing spots in these books is iron. The iron content in foxing spots varied from 126 ppm to 29500 ppm, depending on the darkness of the foxing. The iron content in the clear book paper varied from 15 ppm to 515 ppm. Of the books tested, one was bound by iron staples. This was an Italian book printed in 1891. The paper in the area of the staple bindings contained 2.95% iron. The area around 3.1 Copper-Induced Foxing (see Figure 4)Foxing was observed in paper made in this laboratory. The stock was 50% refined rag/50% Weyerhauser S. G. Kraft, and sized with 1% Hercules Neuphor rosin. Alum was added to a pH of 4.5. Williams freeness of the stock was 300 seconds. Noble and Wood equipment was used in making handsheets. In this equipment, the stock was held in a copper chest, felted in a brass felter, and white water was recirculated from a copper tank. Drying was against a stainless steel drum with a felt belt carrier. The sheet produced was high in copper—98.2 ppm, as shown in Table IV.
Mrs. Katherine Woodward of the laboratory alkalized the paper by the double decomposition method (U.S.P. 3,898,356), dipping first in 10% sodium carbonate solution, then in 10% magnesium chloride, and finally washing out the byproduct, sodium chloride. Sheets were aged at 100�C in the dry oven and 90�C/50% r.h. in the humid oven. Mrs. Woodward reported that in the sheets before treatment and aging there were pale tan spots. After the ovens, a marked development of brown-colored spots was noted in the untreated paper. This was more pronounced in the paper aged in the humid oven than in the dry oven aged paper. The treated paper, however, showed no spotting at any time in the aging study. Another example of what must be considered copper foxing was observed in an 18th century French map apparently colored in some areas with a verdigris pigment. L.C. Restoration staff observed that this map was more brittle in the brown foxed areas than in clear areas. A copper content of 1093 ppm was found in these brown areas, as shown in Table IV. 3.2 Precision of the AnalysisAnalyses for copper and iron content in books and various papers were based on the average of 3–6 replicates. The results, shown as averages, appear in Table VI. The high standard deviation of iron and copper in books and various papers indicated that the elements are not uniformly distributed. TABLE VI MEAN AND STANDARD DEVIATION OF IRON AND COPPER FROM BOOKS AND PAPERS 4 SUMMARY AND CONCLUSIONSOur study indicates that while biological organisms such as molds may be a factor in the formation of foxing spots, copper and iron also seem to play a prominent role. The iron content of foxing spots and clear papers in the books examined showed a significant difference. However, the copper content of these areas was not significantly different. On the other hand, in our handmade paper it was the copper content that varied significantly in these areas. Some foxing spots were more deteriorated than others, but all were deteriorated in relation to the adjacent paper. The data presented show that in many papers iron in amounts over 500 ppm and copper in amounts over 90 ppm are associated with the foxed spots, as shown in Figures 3 and 4, and degraded areas. Since both iron and copper catalyze the oxidation of cellulose, these agents may be primarily or completely responsible for the damage. Other papers show foxing in the presence of small amounts of iron and copper, as shown in Figure 5, and in such cases foxing may well be produced by biological organisms alone. Traditionally, these elements in paper have been analyzed by classical gravimetric and titrimetric analytical techniques, colorimetry, or flame atomic absorption. CRA (Carbon Rod Atomizer) offers a simple, rapid, and extremely sensitive method of determining metals in cellulosic materials directly on the solid sample. The very small solid samples utilized in this technique were useful in demonstrating the wide variation of metal concentrations in the cellulose matrix of a single blank page. CRA provides excellent information on the distribution of the elements throughout the sample and can help to elucidate the cause of foxing spots in library materials. TABLE VII TITLES OF BOOKS AND VARIOUS PAPERS REFERENCESChemist, Preservation Office Laboratory, Library of Congress, Washington, D. C. Read, D. N., Eade, B. D., and Slingsby, N. R. (1968), Pulp and Paper Magazine of Canada, 51. Press, R. E. (1976), Int. Biodetn. Bull., 12(1), 27. Iiams, T. M. (1932), Library Quarterly, II, 375. Iiams, T. M. and Beckwith, T. D., “Notes on the Causes and Prevention of Foxing in Books,” a paper read before the Large College and Reference Libraries Section of the American Library Association, Denver, June 24–29, 1935. Beckwith, T. D., Swanson, W. H., and Iiams, T. M. (1940), “Deterioration of Paper—The Cause and Effect of Foxing,” University of California at Los Angeles, Vol. 1, No. 13, pp. 299–356. Baynes-Cope, D. (1976), Int. Biodetn. Bull., 12(1), 31. Williams, J. C., Fowler, C. S., Lyon, M. S., and Merrill, T. L. (1977), Advances in Chemistry Series, 164, 37. Koenigs, J. W. (1975), “Cellulose as a Chemical and Energy Resource,” C. R.Wilke, Ed., Interscience Publication, John Wiley & Sons, New York. Martin, E. (1963), “Methods of Forensic Science,” F.Lundquist, Ed., Interscience Publishers, New York, Vol. II, pp. 1–33. TAPPI Method T434-os-68. TAPPI Method T243-su-69. Rhodes, J. R., Pradzynski, A. H., and Sieberg, R. D. (1972), I. S. A. Transactions, II, 337. Grennfelt, P., Akerstrom, A., and Brosse, C. (1971), Atmospheric Environment, 5, 1. Cares, J. W. (1968), Journal of American Industrial Hygiene Association, 29, 463. Rhodes, J. R. (1973), American Laboratory, 5, 57. Karayannis, M. I., Vassilaki-Grimani, M., and Grimanis, A. P. (1974), Chimika Chronika, New Series, III, 21. Hoffman, G. L., Duce, R. A., and Zoller, W. H. (1969), Environmental Science and Technology, 3, 1207. Dams, R., Robbins, J. A., Rahn, K. A., and Winchester, J. (1970), Analytical Chemistry, 42, 861. Zoller, W. H. and Gordon, G. E. (1970), Analytical Chemistry, 42, 256. West, P. W. (1969), “Air Pollution,” A. C.Stern, Ed., Academic Press, New York, Vol. II, p. 172. Burnham, C. D., Moore, C. E., Kanabrocki, E., and Hattori, D. M. (1969), Environmental Science and Technology, 3, 472. Hwang, J. Y. and Feldman, F. J. (1970), Applied Spectrometry, 24, 371. Fossum, T., Hartler, N., and Libert, J. (1972), Svensk Papperstidning, 8, 305. Culver, B. R. (1975), “Analytical Methods for Carbon Rod Atomizers,” Varian Techtron Pty. Ltd., Springvale Vic.Australia. ACKNOWLEDGEMENTSThe suggestions and support of Mr. Frazer G. Poole, Assistant Director for Preservation at the Library of Congress, on this project are gratefully acknowledged.
 Section Index Section Index |
