THE INFLUENCE OF OXYGEN ON THE FADING OF ORGANIC COLORANTSJ. S. Arney, A. J. Jacobs, & R. Newman
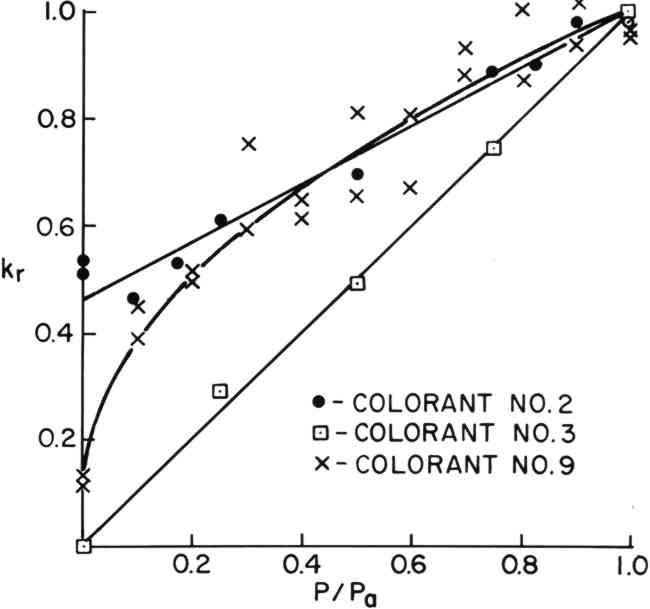
4 RESULTSVALUES of kr were determined for the colorants listed in Table I under atmospheres with relative oxygen concentrations, P/Pa, ranging from 1.00 to 0.0013. The results of these experiments fell roughly into four experimental categories, as discussed below. 4.1 Linear Rate Versus Oxygen ConcentrationColorants #1 through #4 were found to fade at rates that varied linearly with oxygen concentration. The data for colorants #2 and #3, shown in Figure 3, are typical examples. A linear regression of kr versus (P/Pa) allowed an estimate of the rate of fading in the absence of oxygen, and these rates are shown in Table II (A) as i. Colorant #2 appears to fade significantly (i > 0) in the absence of oxygen.
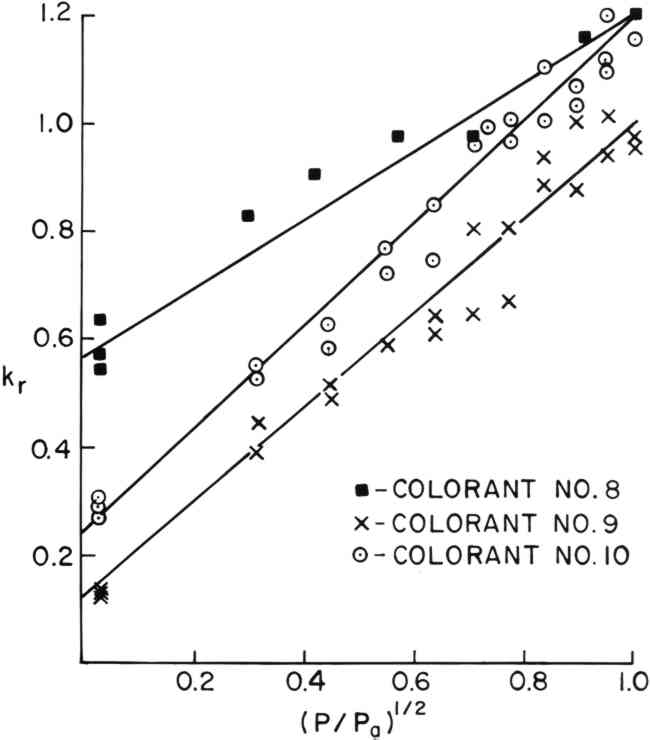
4.2 Linear Rate Versus Square Root of Oxygen ConcentrationThe rates of fading of colorants #5 through #11 did not decrease linearly with oxygen concentration but appeared to turn down sharply at the lower oxygen concentrations. Colorant #9, shown in Figure 3, is a typical example. It was found, empirically, that the rate of fading of colorants #5 through 11 varied linearly with the square root of the oxygen concentration, as shown in Figure 4 for colorants #8, #9, and #10. A linear regression of kr versus (P/Pa)� allowed an estimate of the rate of fading of these colorants in the absence of oxygen, and these rates are shown in Table II (B) as i. Colorants #5 through #8 appear to fade significantly (i > 0) in the absence of oxygen.
4.3 Experimentally Uncertain DataColorants #12 through #15 were found to fade less rapidly in the absence of oxygen, but the values of kr obtained were not of sufficient precision to allow an interpretation of the relationship between kr and (P/Pa). Linear regressions of the data with respect to both (P/Pa) and (P/Pa)� were performed. The values of i and the 95% confidence intervals for i were roughly the same for both regressions. The values of i given in Table II (C) represent the values obtained from the regression that gave the highest correlation, r2. 4.4 Rate Increase with a Decrease in Oxygen ConcentrationColorants #16 and #17 were found to fade more quickly at P/Pa = 0.0013 than at P/Pa = 1.00. Such behavior has been observed for a number of colorant systems12,13,14 and extensive studies of these two colorants were not carried out. |

