CELLULOLYTIC BIODEGRADATION OF COTTON FIBERS FROM A DEEP-OCEAN ENVIRONMENTRUNYING CHEN, & KATHRYN A. JAKES
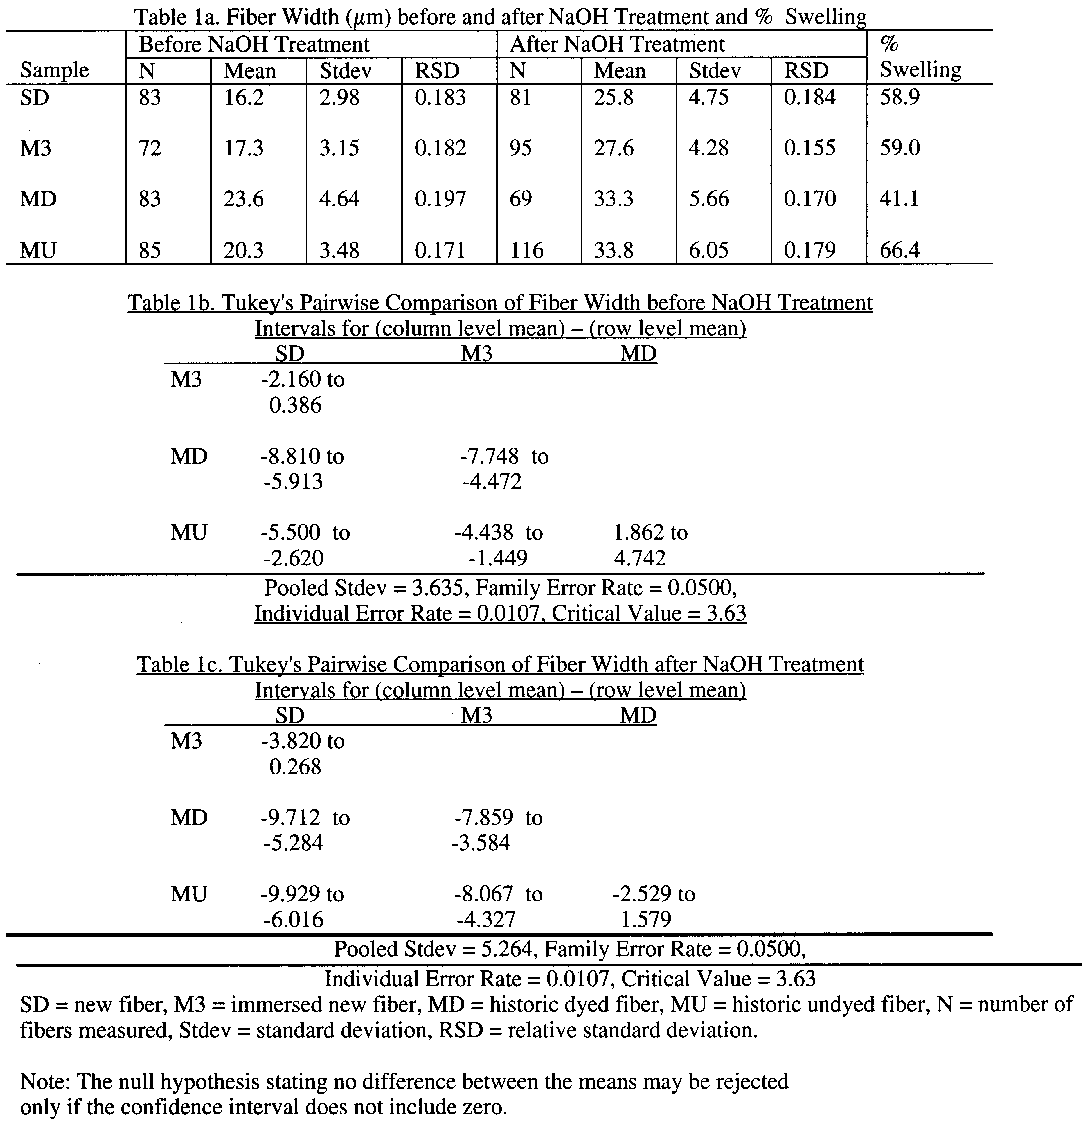
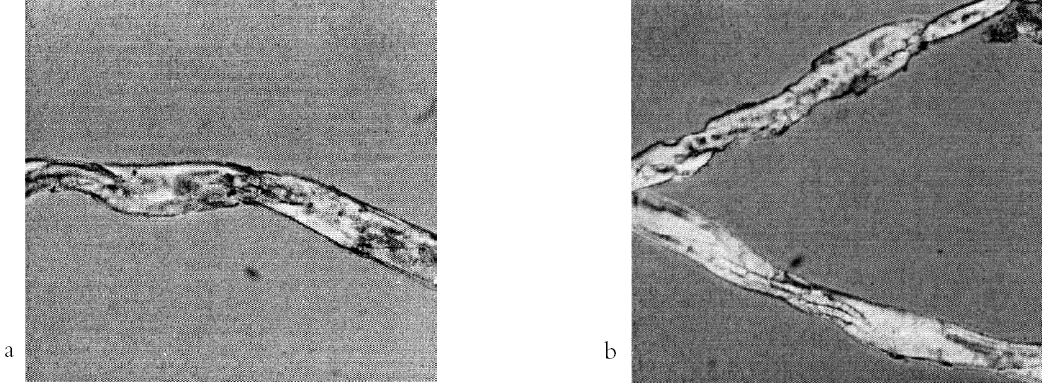
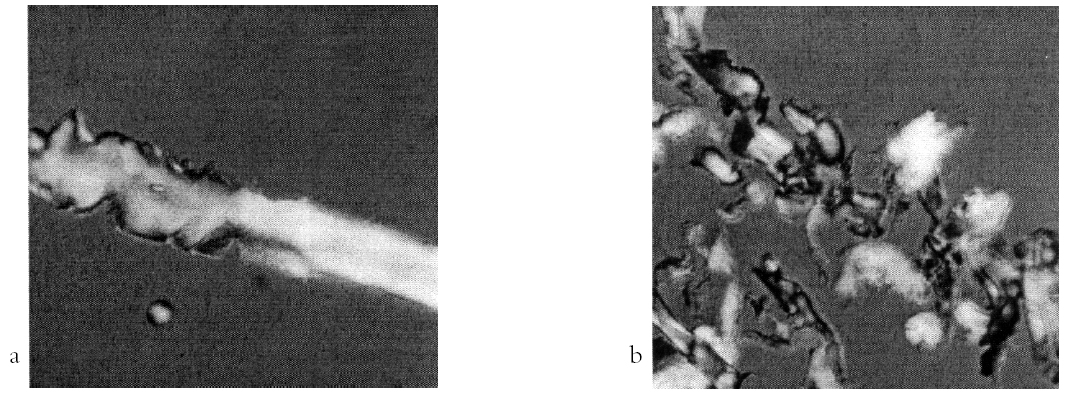
2 RESEARCH METHODS2.1 SAMPLESThe dyed cotton sample was composed of three pieces measuring approximately 15 x 5 mm each and was removed from inconspicuous seams inside the waistcoat. The sample of the undyed cotton lining was composed of three pieces measuring approximately 5 x 3 mm each. These samples are designated as historic dyed (MD) and historic undyed (MU) in the discussion and tables that follow. For comparative purposes, two additional cotton fabrics were sampled and studied in conjunction with those from the marine environment. One new cotton sample (SD) was taken from a reference fabric (TestFabrics Company, no. 8588). The other sample was taken from the same reference fabric that had been immersed for three months at the same deep-ocean site where the trunk was retrieved. This sample was labeled immersed new sample (M3) for the purposes of the discussion. Three sets of the fiber specimens from each of the four samples were mounted for examination with optical microscopy. One set of fiber specimens (72–85 individual fibers) obtained from each of the four fabric samples was mounted on slides in Permount (table 1). A second set of fiber specimens (69–116 individual fibers) from each of the four samples was mounted on microscope slides with 18% (w/v) sodium hydroxide and observed and measured after five minutes. A third set of specimens was prepared by treating yarns from each of the four samples with a mixture of equal volumes of aqueous 18% sodium hydroxide (NaOH) and carbon disulfide (CS2) for 30 minutes. At least 30 individual fiber specimens were removed from these treated pieces and mounted on slides for examination. 2.2 OPTICAL MICROSCOPYA Zeiss Axioplan research microscope with differential interference contrast (DIC), phase
2.3 SCANNING ELECTRON MICROSCOPY (SEM)A Philips XL30 equipped with a Be-window, a Tracor Northern TN-5500 Micro-Z analyzer, a VISTA SQ computer image analysis system, and a 20 keV accelerating voltage were employed in this work. In addition to micrographs taken with Polaroid type 55 film, the SEM images were digitized for analysis using Adobe Photoshop 5.0 software. Fifteen fiber specimens from each of the four samples were mounted on carbon planchets with double-side carbon tape and coated with gold and palladium using a Denton Vacuum Desk II sputter coater.
2.4 ENERGY DISPERSIVE X-RAY SPECTROSCOPY (EDS)An Oxford Instruments Group Link Analytical eXL with a Pentafet detector, coupled with a JEOL JSM 820 SEM and a conventional Be window, was used for elemental analysis. Fifteen fibers from each of the four samples were mounted on carbon planchets and coated with carbon. After qualitative analysis and calibration with a copper standard, quantitative elemental analysis was performed on each of the 15 fibers. With x-ray spectra collected for 100 seconds of live-time from fiber areas under 1,000x magnification and using an acclerating voltage of 20 keV, an average elemental composition of the entire sampling area was obtained. After acquisition of the spectra, the percentage of each significant element in the spectra was normalized by dropping the elements with x-ray counts below the instrument detection limit. Because the mean percent elemental composition of each element is calculated only for the heavy elements, and the quantity of carbon, oxygen, and other light elements is unknown, the percent elemental composition that was determined was employed only to indicate relative predominance of elements present in the samples. |


